Evaluating Risk Prediction with ROC Curves
|
Software |
|
|
Courses |
Overview
This page briefly describes methods to evaluate risk prediction models using ROC curves.
Description
When evaluating the performance of a screening test, an algorithm or a statistical model – such as a logistic regression – for which the outcome is dichotomous (e.g. diseased vs. non-diseased), we typically consider sensitivity, specificity, positive predictive value (PPV) and negative predictive value (NPV). These are useful tools, but have the disadvantage of referencing a single cut-point, and requiring an abstract assessment of the appropriate trade-off between sensitivity and specificity, while PPV and NPV are influenced by population prevalence. Receiver Operating Characteristic (ROC) Curves provide a graphical representation of the range of possible cut points with their associated sensitivity vs. 1-specificity, (i.e. false positives rate). This illustrates the merit of the particular predictor/predictive model, making it possible to identify different cut-points for specific applications – depending on the ‘cost’ of misclassification. Estimates of the area under the curve (AUC) provide an indication of the utility of the predictor and a means of comparing (testing) two or more predictive models.
The diagnostic performance of a test is the accuracy of a test to discriminate diseased cases from normal controls. ROC curves can also be used to compare the diagnostic performance of two or more laboratory tests.
ROC Curves plot the true positive rate (sensitivity) against the false positive rate (1-specificity) for the different possible cutpoints of a diagnostic test. Each point on the ROC curve represents a sensitivity/specificity pair.

-
The closer the curve follows the left side border and the top border, the more accurate the test.
-
The closer the curve is to the 45-degree diagonal, the less accurate the test.
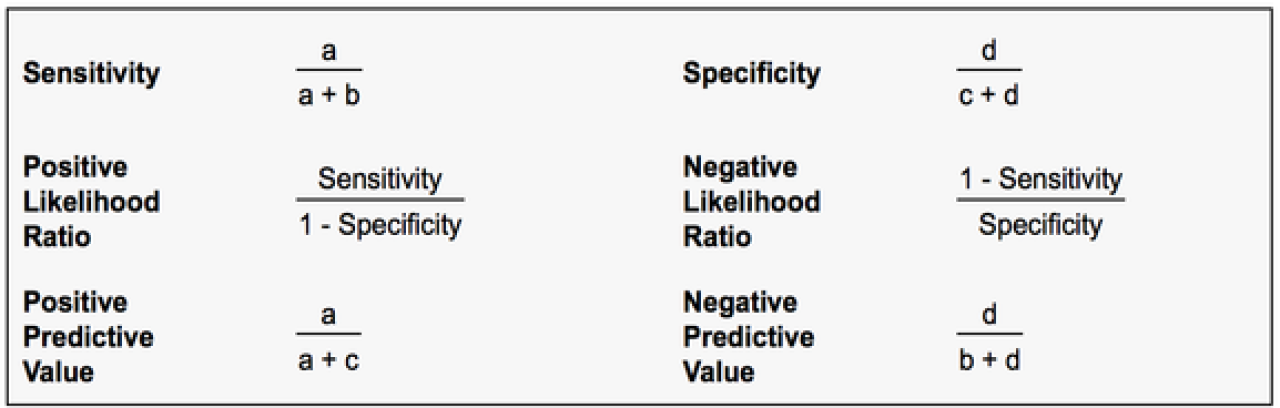
TO understand ROC curves, it is helpful to get a grasp of sensitivity, specificity, positive preditive value and negative predictive value:
The different fractions (TP, FP, TN, FN) are represented in the following table.

-
TP=True Positive: cases with the disease correctly classified as positive
-
FN= False Negative: cases with the disease incorrectly classified as negative
-
TN= True Negative: cases without the disease correctly classified as negative
-
FP= False Positive: cases without the disease incorrectly classified as positive
The following statistics can be defined:
-
Sensitivity: probability that a test result will be positive when the disease is present (true positive rate, expressed as a percentage).
= a / (a+b) -
Specificity: probability that a test result will be negative when the disease is not present (true negative rate, expressed as a percentage).
= d / (c+d) -
Positive likelihood ratio: ratio between the probability of a positive test result given thepresence of the disease and the probability of a positive test result given the absence of the disease, i.e.= True positive rate / False positive rate = Sensitivity / (1-Specificity)
-
Negative likelihood ratio: ratio between the probability of a negative test result given thepresence of the disease and the probability of a negative test result given the absence of the disease, i.e.= False negative rate / True negative rate = (1-Sensitivity) / Specificity
-
Positive predictive value: probability that the disease is present when the test is positive (expressed as a percentage).
= a / (a+c) -
Negative predictive value: probability that the disease is not present when the test is negative (expressed as a percentage).
= d / (b+d)
Readings
Textbooks & Chapters
Gönen M. Analyzing Receiver Operating Characteristic Curves with SAS. 2007, Cary: North Carolina: SAS Publishing.
As with most SAS-specific books, this is a very practical guide. It has a fair amount of theory/ background but this is not its primary goal or strength. Since SAS did not have a built-in ROC procedure, this book provides the necessary macros and code and links to datasets available online.
Hunink MGM, Glasziou PP, Siegel JE, Weeks JC, Pliskin J, Elstein A & Weinstein M. Decision Making in Health and Medicine: Integrating Evidence and Values, Chapter 7. 2001, Cambridge, UK: Cambridge University Press.
This chapter provides an overview and introduction to ROC for the purposes of comparing multiple test results in order select the most beneficial. Focuses on clinical medicine (not epi).
Zou KH, Liu A, Bandos AI, Ohno-Machado L & Rockette HE. Statistical Evaluation of Diagnostic Performance: Topics in ROC Analysis. 2011, London: Chapman & Hall/CRC Biostatistics Series
Award-winning lead author who has published some definitive papers on this topic.
Methodological Articles
-
Metz CE. Basic principles of ROC analysis. Seminars in Nuclear Medicine, 1978, 8(4): 283–298
-
Hanley JA & McNeil BJ. The meaning and use of the area under a receiver operating characteristic (ROC) curve. Radiology 1982, 143: 29–36
-
Hanley JA & McNeil BJ. A method of comparing the areas under receiver operating characteristic curves derived from the same cases. Radiology 1983, 148(3): 839–843.
-
Venkatraman ES & Begg CB. A distribution-free procedure for comparing receiver operating characteristic curves from a paired experiment. Biometrika 1996, 83(4): 835–848
-
Obuchowski NA. Receiver operating characteristic curves and their use in radiology. Radiology 2003; 229(1): 3–8.
-
Obuchowski NA. Fundamentals of clinical research for radiologists: ROC analysis. American Journal of Roentgenology 2005, 184: 364–372
-
Fawcett T. An introduction to ROC analysis. Pattern Recognition Letters 27. 2006, 861–874
-
Zou KH, O’Malley AJ & Mauri L. Receiver-Operating Characteristic analysis for evaluating diagnostic tests and predictive models. Circulation 2007, 115: 654–657
-
Cook N. Use and misuse of the Receiver Operating Characteristic Curve in risk prediction Circulation 2007, 115:928-935
-
Vergara IA, Norambuena T, Ferrada E, Slater AW & Melo F. StAR: a simple tool for the statistical comparison of ROC curves. BMC Bioinformatics 2008, 9:265
-
Seshan VE, Gönen M. & Begg CB. Comparing ROC curves derived from regression models. Memorial Sloan Kettering Working Paper 20. 2011
-
Park SH, Goo JM, Jo C. Receiver Operating Characteristic (ROC) Curve: Practicial Review for Radiologists. Korean Journal of Radiology 2004, 5(1): 11-18.
-
A good review of ROC in basic terms. No coding or reliable rundown of current software however.
-
-
Eng J. Receiver Operating Characteristic Analysis: A Primer. Acad Radiol. 2005; 12:909-916
-
Very nice review of ROC curves, good graphics included.
-
-
Illustrative Logistic Regression Examples using PROC LOGISTIC: New Features in SAS STAT 9.2
-
SAS code, with minimal explanation of output however. Good for perfecting the look of figures.
-
Application Articles
Partheen K, Kristjansdottir B & Sundfeldt K. Evaluation of ovarian cancer biomarkers HE4 and CA-125 in women presenting with a suspicious cystic ovarian mass. J Gynecol Oncol 2011: 22 (4): 244-252.
The relative merits of two screening tests employed individually or in combination are assessed and optimal cut-points for clinical use are determined using ROC curves amongst a population of women already assigned to surgery (despite the historically poor predictive validity of the tests on which that decision had been based!).
McBrien KA, Kleinman KP, Abrams AM & Prosser LA. Use of outcomes to evaluate surveillance systems for bioterrorist attacks. BMC Medical Informatics and Decision Making 2010, 10:25
http://www.biomedcentral.com/1472-6947/10/25
Here is a good example of a public health application of ROC methods using both observed (surveillance system) and simulated data sets. The authors demonstrate both traditional ROC and weighted curves incorporating a cost factor. They contrast the trapezoidal, rectangular and truncated methods for calculating and comparing the area under the curve (AUC).
van Toorn R, Springer P, Laubscher JA & Schoeman JF. Value of different staging systems for predicting neurological outcome in childhood tuberculous meningitis. International Journal of Tuberculosis and Lung Disease 2012 16(5):628–632.
ROC analysis is used to compare different staging systems for TB meningitis in children from which to predict neurological outcomes after 6 months of treatment. Discrimination between the different scoring systems was tested using the area under the receiver operating curves (AUC).
Websites
http://www.medcalc.org/features/roccurves.php?gclid=CKu_2aiJu68CFYRM4AodIVLTkQ
Software – available for a free trial – with which to perform analysis, produce graphs, obtain AUC by two methods and get confidence intervals for the AUC.
http://www.rad.jhmi.edu/jeng/javarad/roc/JROCFITi.html
Here is an interactive online ROC calculator- have fun!
https://stats.oarc.ucla.edu/stata/faq/how-can-i-test-the-difference-in-area-under-roc-curve-for-two-logistic-regression-models/
UCLA provides a worked example showing how to compare two AUCs. Stata does have built-in ROC commands for easy coding.
https://stats.oarc.ucla.edu/sas/seminars/whatsnew92/
SAS 9.2 introduced some ROC capacities demonstrated here. Scroll about three-quarters of the way down to see the ROC example code and graph.
http://www.mskcc.org/sites/www.mskcc.org/files/node/11749/documents/sas-code-macros.txt
Example SAS code