Adjusted Attributable Fractions
|
Software |
|
|
Websites |
|
|
Courses |
Overview
Attributable fractions (AFs) are measures of association between a disease and a specific exposure that attempt to assess the public health impact of that exposure.
Description
Levin first introduced AFs in 1953. The proposed formula assumed that the proportion with disease would be equal among the exposed and the unexposed under the null hypothesis of no influence of exposure on disease, and used the relative risk (RR) and the prevalence of the exposure of interest to estimate the number of exposed cases in excess of those expected.

(Levin 1953, Walter 1975)
It is important to note that Levin’s attributable fraction is referred to by various terms in the literature. Literature reviews suggest that “attributable risk” and “population attributable risk” are the most commonly used terms (Uter and Pfahlberg 1999). More recently, “attributable fraction” appears to have matched the popularity of “population attributable risk”
Excess fractions vs. Etiologic fractions
Rothman explains that there are two major classes of attributable fractions. (Rothman, Greenland et al. 2008)
-
Excess fractions measure the number of excess cases of disease due to a specific exposure of interest.
-
Etiologic fractions measure the number of cases of disease due to a specific exposure of interest.
This distinction between excess and etiologic fractions causes a tension. The distinction may be framed within a discussion of timing (with regards to classifying cases that would have still occurred in the study period, but at a later moment, had they not been exposed) or with reference to assumptions of monotonicity (with regards to whether the population includes preventive types that may couterbalance some of the causal types), When calculating AFs researchers often hope to interpret the measure as an etiologic fraction, however, they have likely calculated an excess fraction. Etiologic fractions are never directly estimable because the disease risk in the exposed takes into account both those individuals who got the disease due the exposure (causal) and individuals who got the disease through a mechanism not including the exposure (doomed).
Excess fractions will be less than etiologic fractions even if the disease is rare, and Rothman states that they can be thought of as “lower bounds” for the etiologic fraction. Authors need to be careful in wording the interpretation of AFs so as not to confuse the excess and etiologic fractions. (Rockhill, Newman et al. 1998)
Interpretation of Attributable Fraction (Benichou 2001)
The interpretation of the AF changes with the type of study data used to calculate the measure.
-
Cross-sectional study: In a cross sectional study, the AF represents the excess of prevalent cases of disease that can be attributed to the exposure of interest.
-
Cohort study: In a cohort study, the AF represents the excess of incident disease cases that can be attributed to exposure of interest. However, cohort studies are often used when the exposure of interest is rare to allow for over-sampling of the exposure. The potential difference in prevalence of exposure in a cohort study vs. the general population can result in less generalizable AFs.
-
Case-control study: In a case-control study, the AF is traditionally calculated using the odds ratio to estimate the risk ratio. This approach requires the rare-disease assumption.
Adjusted Attributable Fractions
As with other traditional measures of association, the AF will be biased if there are confounding factors. Thus, there is a need for methods to calculate adjusted AF estimates. (Bruzzi, Green et al. 1985)
Stratified Analysis
Benichou describes two main methods for calculating adjusted AFs using stratified analysis: the Mantel–Haenszel (MH) approach and the weighted sums approach. (Benichou 2001)
-
The Mantel–Haenszel approach to adjusted attributable fractions assumes no interaction between the exposure and the third variable. MH estimators have the advantage of consistent variance even under conditions of sparse data. However, the MH variance estimates are more cumbersome to calculate.
-
The weighted sums approach makes no assumptions about interaction.

However, the weighted sums approach should not be used when analyzing sparse data. Notice that the MH approach can be viewed as a special instance of the weighted sums approach.
Adjusted Attributable Fractions Through Modeling
Greenland and Drescher first introduced methods to calculate adjusted AFs directly from regression models. (Greenland and Drescher 1993, Ruckinger, von Kries et al. 2009) Their approach can be adapted for many regression models. (Benichou 2001)
-
For case–control studies, unconditional or conditional logistic regression models are appropriate.
-
For cross-sectional studies, logistic regression or relative risk regression models are appropriate.
-
For cohort studies, logistic regression, relative risk regression, Poisson regression, or Cox regression can all be appropriate depending on the data collection method.
The adjusted AF can be calculated from a model containing all known risk factors of disease using the following steps: (Gefeller 1992, Eide and Gefeller 1995, Ruckinger, von Kries et al. 2009)
-
The exposure of interest is “removed” by classifying all individuals as unexposed.
-
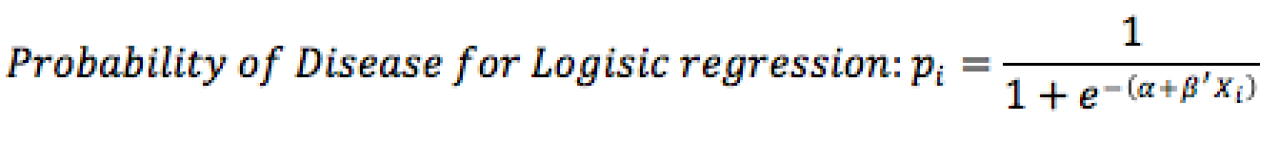
A model using the re-classified data is used to estimate the probability of disease for each individual.
-
The sum of predicted probabilities represents the expected number of cases of disease if the exposure of interest were removed from the population.

Sequential and Average Adjusted Attributable Fractions
If steps 1-4 described above are repeated for multiple exposures of interest, then Eide and Gefeller proposed a method for calculating the additional effect of removing each subsequent exposure after having removed the first exposure in the population. By removing exposures in turn, it is possible to calculate a sequential attributable fraction by subtracting the adjusted attributable fraction with only the first exposure removed from the adjusted attributable fraction with both the first and second exposures removed. Understandably, this method is sensitive to the order in which exposures are “removed” from the population. (Eide and Gefeller 1995)
It is possible to remove the dependency on order. If there are L exposure variables, there will be L! different orders in which the of the exposures can be removed from the model. Eide and Gefeller suggested averaging the adjusted AFs calculated across all L! models to calculate the average attributable fraction. (Eide and Gefeller 1995, Ruckinger, von Kries et al. 2009)
Ruckinger et al. conducted a comparison of the sequential and average AF estimates and concluded that the average AF method yielded the most plausible results. However, there are no statistical tests or other empirical methods to compare approaches.
Limitations of Attributable Fractions Methods
As with all methods, the accuracy of adjusted AFs depends on the completeness of the regression models from which they are calculated. If a major confounder is not included in the model, the AF estimate will be biased.
The application of adjusted AF calculations to continuous variables is theoretically possible using regression, but the interpretation of these AFs poses a challenge. (Ruckinger, von Kries et al. 2009)
There is debate about whether the AFs in a single model can add to more than 100%. Authors, who suggest that a sum of more than 100% is acceptable, argue that several risk factors can contribute to the development of disease; therefore the total AF can exceed 100%. (Rowe, Powell et al. 2004, Poole 2015)
Readings
Textbooks & Chapters
Rothman, K. J., S. Greenland and T. L. Lash (2008). Modern epidemiology. Philadelphia, Wolters Kluwer Health/Lippincott Williams & Wilkins.
Articles
Understanding the Attributable Fraction
Levin, M. L. (1953). “The occurrence of lung cancer in man.” Acta Unio Int Contra Cancrum 9(3): 531-541.
Uter, W. and A. Pfahlberg (1999). “The Concept of Attributable Risk in Epidemiological Practice.”Biometrical Journal 41(8): 985-993.
Walter, S. D. (1975). “The Distribution of Levin’s Measure of Attributable Risk.” Biometrika 62(2): 371-374.
Adjusted Attributable Fractions
Benichou, J. (2001). “A review of adjusted estimators of attributable risk.” Stat Methods Med Res10(3): 195-216.
Bruzzi, P., S. B. Green, D. P. Byar, L. A. Brinton and C. Schairer (1985). “Estimating the population attributable risk for multiple risk factors using case-control data.” Am J Epidemiol 122(5): 904-914.
Eide, G. E. and O. Gefeller (1995). “Sequential and average attributable fractions as aids in the selection of preventive strategies.” J Clin Epidemiol 48(5): 645-655.
Gefeller, O. (1992). “Comparison of adjusted attributable risk estimators.” Statistics in Medicine11(16): 2083-2091.
Greenland, S. and K. Drescher (1993). “Maximum likelihood estimation of the attributable fraction from logistic models.” Biometrics 49(3): 865-872.
Ruckinger, S., R. von Kries and A. M. Toschke (2009). “An illustration of and programs estimating attributable fractions in large scale surveys considering multiple risk factors.” BMC Med Res Methodol 9: 7.
Limitations of Attributable Fractions
Rockhill, B., B. Newman and C. Weinberg (1998). “Use and misuse of population attributable fractions.” American Journal of Public Health 88(1): 15-19.
Rowe, A. K., K. E. Powell and W. D. Flanders (2004). “Why population attributable fractions can sum to more than one.” Am J Prev Med 26(3): 243-249.
Poole, C. (2015). “A history of the population attributable fraction and related measures.” Annals of Epidemiology 25(3): 147-154.